3.1.1 Flow rate optimization
In order to know the differences with respect to changes in carrier gas flow rate, the wire/generator (wire A) was set-up at a fixed voltage of 7 V. As indicated in Fig. 2(a), the optimum carrier flow rate was observed to be between 1-1.5 L min-1, resulting in maximum and stable number concentration. As the flow rate increased above 4 L min-1, aerosol concentration was reduced appreciably. At higher carrier gas flow rates, wire cools more efficiently, reducing its temperature and, hence, lowering the evaporation rate. Also these vapors no longer remain supersaturated due to lesser temperature gradient between vapor and carrier gas affecting the number concentration.
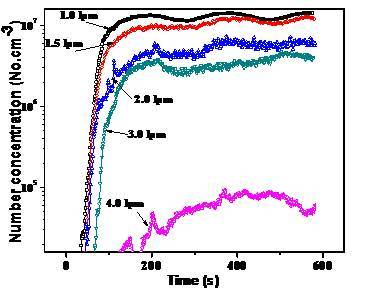
Figure 2(a): Effect of carrier gas flow rate on number.
3.1.2 Voltage optimization
Although applied voltage in the range of 6-7 V looked optimum for generation of high concentration of nano-aerosols, another experiment was performed for studying the effect of the applied voltage on the maximum number concentration. This experiment was performed at a fixed flow rate of 1 L min-1. The result has been shown in Fig. 2 (b). As observed, the maximum aerosol concentration reached to a saturation level after about 6 V (for wire A).
Based on the above experiments, optimized operating parameters (for wire A & B and of similar composition) were fixed as follows:
- Applied voltage : 6-9 V (Power: 30-50 W)
- Carrier gas flow rate (Air /Argon): 1-1.5 L min-1
- Maximum aerosol concentration achieved: ~ > 107 cm-3
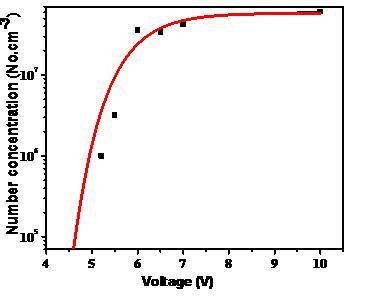
Figure 2(b): Effect of applied voltage concentration
3.2 Generator output characterization
In the second step, experiments were carried out to characterize the output of generator in terms of aerosol properties. Also, long time stability of generator was tested in some of the experiments. Size characteristics were interpreted using SMPS.
3.2.1 Number concentration emission
The electrical heating by the applied voltage requires some time to overcome the vaporization threshold after which the vapor emission from the wire starts. These vapors then self-nucleate to form aerosols in the nano size range and are guided to the measurement point using carrier gas. Fig. 3 shows behavior of aerosol concentration as measured by CPC for wire A in different set of experiments. As observed, wire A took about 50 seconds to warm up for vapor production and another 50-100 seconds for achieving saturation aerosol concentration. It can also be seen, saturation number concentration was of the order of 107 cm-3 for this wire which was more or less similar for the other wire as well.
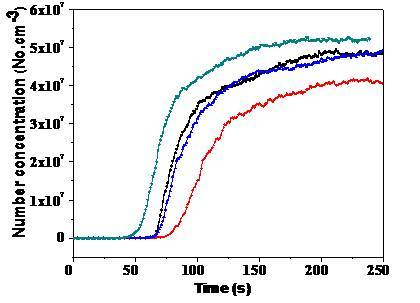
Figure 3: Aerosol number concentration at 1.0 L min-1 carrier flow and applied voltage of 7 V
Fig. 4 shows the long term behavioral response of wire A with the optimized parameters. It can be seen that, the number concentration remained in order of 107 cm-3 or more when output was observed at the generator exit ensuring the steady nano-aerosol output form the generator.
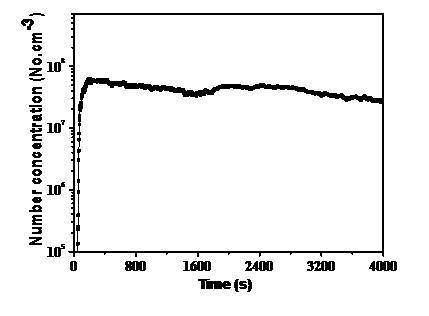
Figure 4: Long Term response of generator output
3.2.2 Particle size distribution
The developed generator is capable to produce nanoparticle aerosols of high number concentration and appreciably less dispersity. SMPS was used in a separate set of experiments intended to measure size distribution of the generated aerosols. The results have been shown in Fig. 5 (a & b) for wire A & B, respectively. As seen from figures below, for wire A, the particle geometric mean diameter obtained was ~15-16 nm with geometric standard deviation (GSD) of ~1.4 and for wire B; it was ~14.8 nm with GSD of ~1.4.
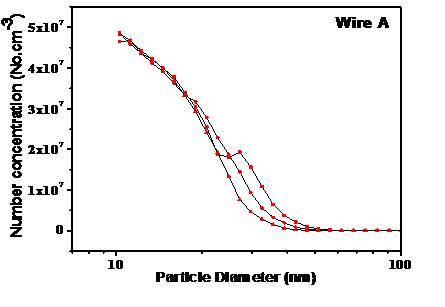
Figure 5(a): Aerosol size distribution from generator for Wire A
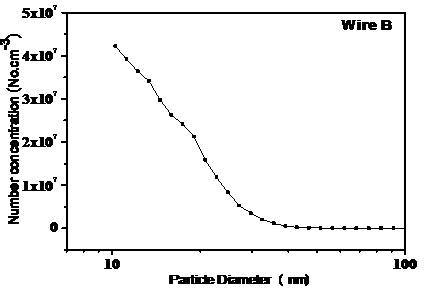
Figure 5(b): Aerosol size distribution from generator for Wire B
